Arkham Visualizer 2.0
October 15, 2026
Paste any address or entity and its incoming and outgoing transactions render in real time as an interactive graph: every transfer, every counterparty, every token in one view.
Here’s what’s new:
In addition to a complete visual redesign, Visualizer 2.0 adds a volume overview for the visualized data, a transaction details module as well as keyboard shortcuts - so cmd/ctrl + Z undoes your last move instead of making you rebuild the graph from scratch.
You can also save a custom visualization and share it with someone else.
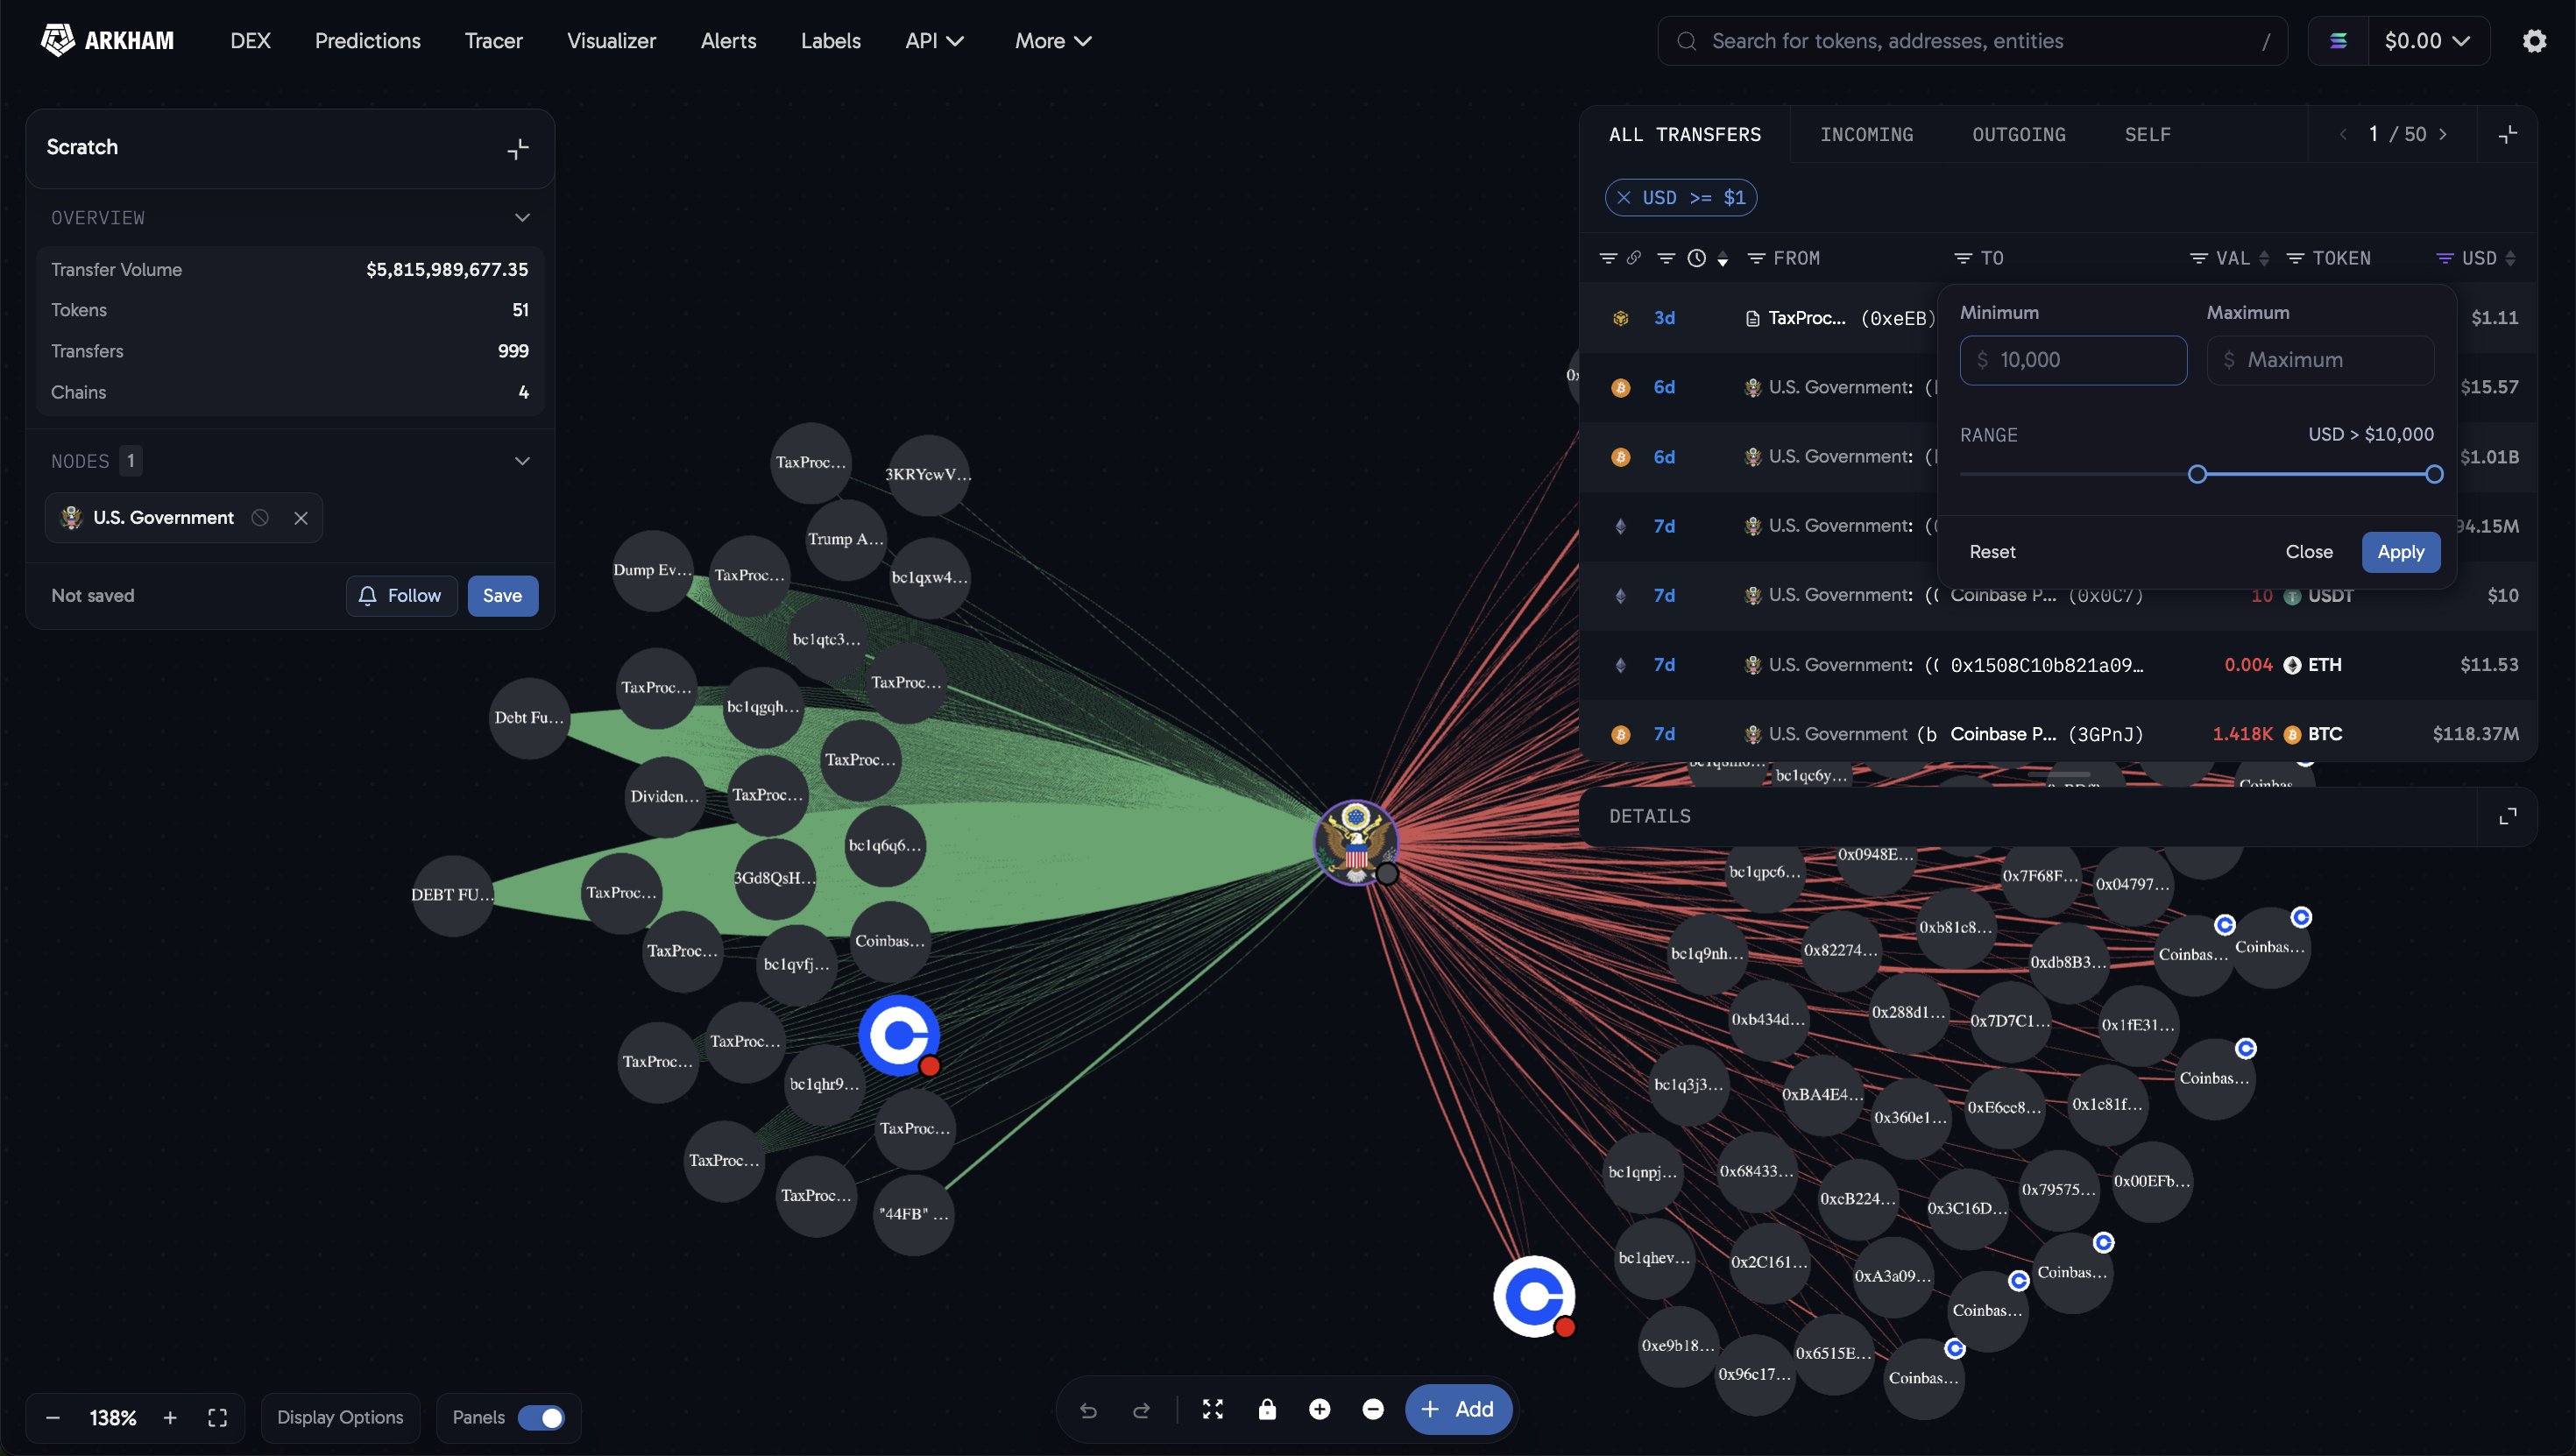
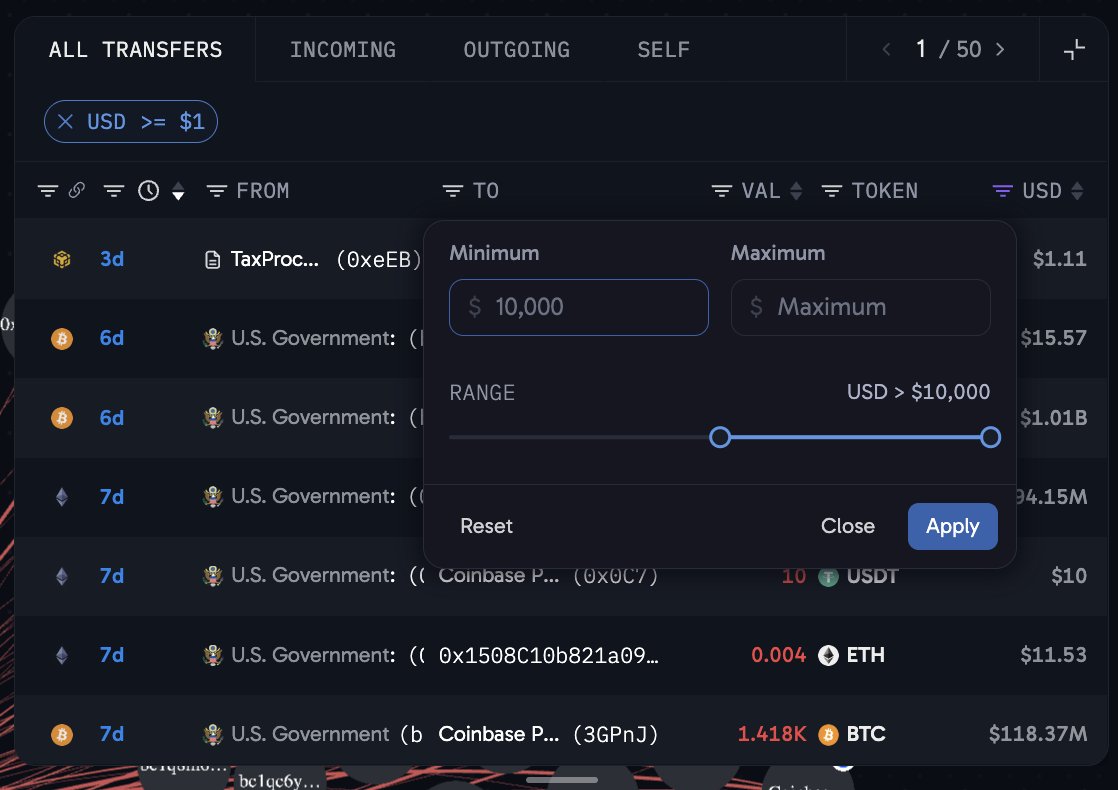
You can filter the graph by token, USD value, direction, time or chain. Select parameters like inflows/outflows of a certain token, or only the last 24 hours, and the graph updates live. Click any transaction to open its full details, or zoom into any cluster.
Try it out now on our US Government entity, to see the largest stash of seized crypto in the world.